
Is the new normal just the ‘old’ normal?
Is the new normal just the ‘old’ normal?
Summary
So far in 2026, economic growth has been resilient in the US, Europe and the UK. Bond markets are starting to reflect two realities: inflation remains elevated, and economic growth appears to have weathered the energy price shock, for now. However, higher energy prices and the rise in borrowing costs are likely to slow the pace of growth somewhat.
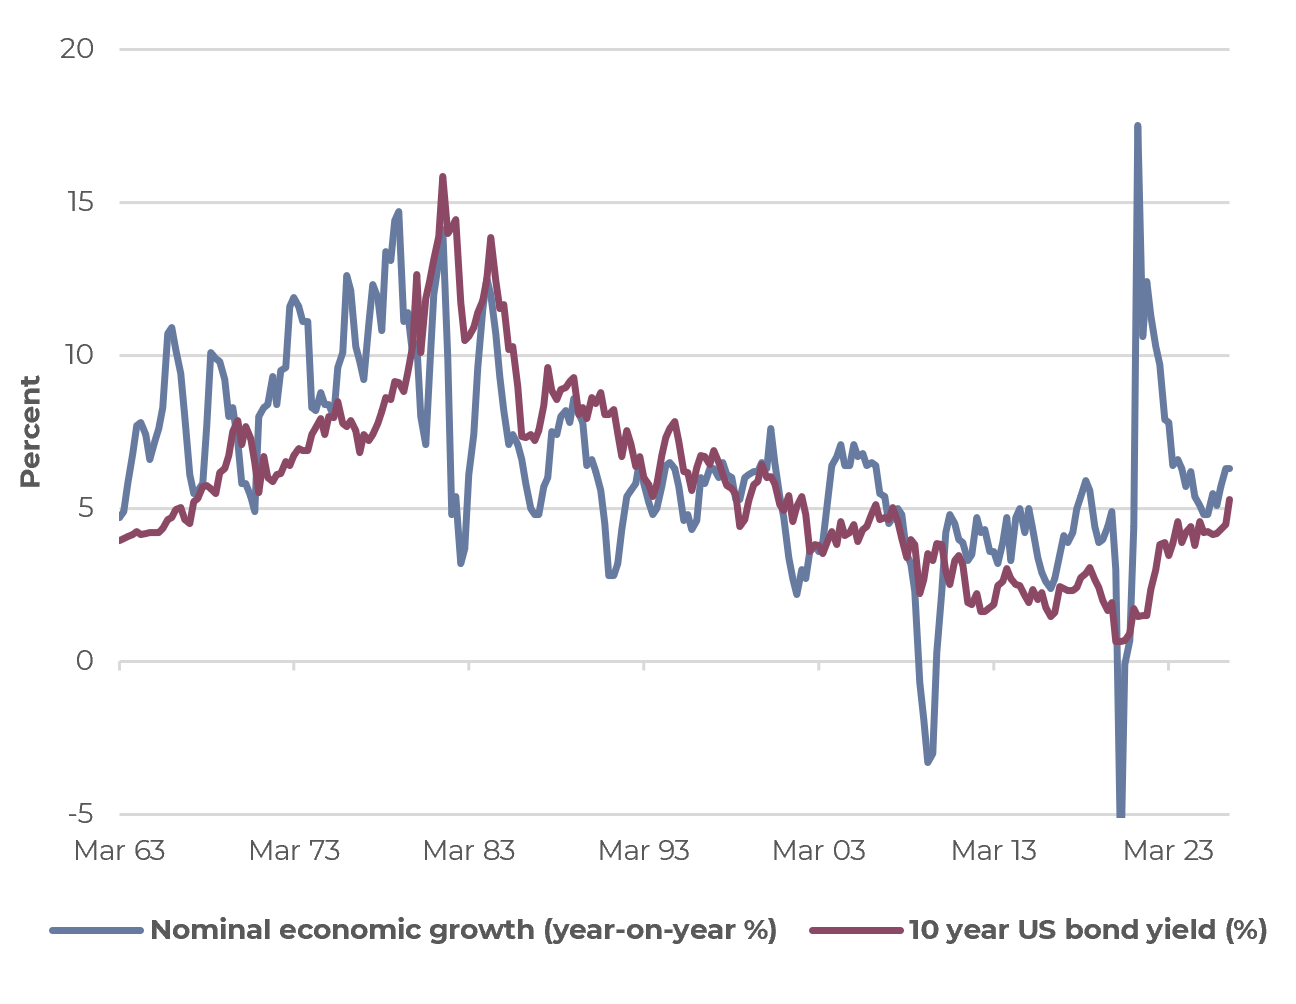
Nominal economic growth (real growth plus inflation) has returned to a pace last seen before the 2007–09 financial crisis. Between 2007 and 2019, weaker growth led to a long period of low bond yields. As nominal growth has picked up, bond yields have risen to levels that look high by recent standards but are back in the range seen between 1990 and 2007, the ‘old’ normal.
Higher bond yields are putting pressure on borrowers with heavy debts. Few companies fall into this group, but many households and governments do. Higher borrowing costs have slowed the housing market in both the UK and the US, and governments must find ways to reduce their debt burden without provoking a backlash from voters or from investors.
As we enter the third-quarter results season, investors will want to see evidence that heavy spending on AI is turning into revenue, as well as any signs that higher borrowing costs are holding back spending plans.
The US faces a bout of election fever, as the midterms take place in November. High oil prices have weighed on US consumer confidence, which is likely to hurt the governing Republican Party. The Democrats appear likely to win the House of Representatives, while the Senate race is much closer. In the run-up to the elections, policy announcements from the White House may become less predictable, which could add to market volatility.
Share prices have risen this year, but company profits have risen faster, so markets now look cheaper (on lower valuations) than they did in January. That suggests investors remain somewhat sceptical about how long the AI investment boom will last.
War and debt: a toxic mix
Although attention has shifted from the Gulf back towards Ukraine, the global economy is still being buffeted by energy prices. The conflict with Iran and attacks on Gulf refineries cut Middle East output, pushing up diesel prices. In July, the International Energy Agency (IEA) noted that shipments of refined products such as diesel leaving the Gulf were still under half their February pace, while crude oil shipments were at nearly three-quarters of their February levels. More recently, the US Treasury has said Persian Gulf crude exports are at or near pre-war levels. So crude supply has largely returned to normal, but diesel supply has not, because damaged refineries will take time to repair.
Higher fuel costs are showing up in inflation data in both Europe and the US. With the US midterm elections only weeks away, higher inflation has led some commentators to suggest the Democrats could win both Houses of Congress. A Democrat-controlled Congress would be expected to limit some of President Trump’s actions. However, that assumes the President continues to act within constitutional conventions. A risk is that, under greater pressure and scrutiny, policy-making becomes less predictable.
Higher inflation has been a significant contributor to higher bond yields. Readers with longer memories may recall when inflation and bond yields were much higher, and wonder what all the fuss is about. The difference is that before the 2007–09 financial crisis, government debt levels were much lower, so governments could afford to pay higher interest rates to fund their deficits. For countries such as France, with high debt and a stubbornly large deficit, the rise in inflation caused by the conflict with Iran is making that debt harder to afford.
Is the new era just the old normal?
The 1990s and early 2000s could be described as a period of calm (although it didn’t always feel like it at the time). Greater globalisation, relative geopolitical calm and easing inflationary pressure led to a long period of stable inflation and relatively strong economic growth. Nominal economic growth averaged 5.5% between 1999 and 2007, and the US 10-year government bond yield averaged 5.6%, with yields lower in the second half of that period as the inflation fears of the 1980s faded from investors’ memories.
The 2007–09 financial crisis may have brought about a long-lasting change. At first, households and companies reduced their debts and governments attempted some austerity. The pressures were compounded by trade tensions between the US and China during President Trump’s first term in the White House. As a result, between 2007 and 2019 nominal economic growth ran at around 3.5%, 2 percentage points lower than the 1990–2007 rate. US 10-year bond yields averaged 2.7% over this period.
So, are we back to a pre-2007 environment for nominal economic growth, albeit one with higher inflation? Since 2023, following the disruption and subsequent recovery from Covid, nominal growth has averaged 5.5% and US 10-year bond yields 4.3%. That is much closer to the ‘old’ normal than to the low-yield years after the 2007–2009 financial crisis.
Nominal economic growth has returned to rates last seen before the 2007 financial crisis, helping push US 10-year bond yields back to ‘old’ normal levels
Source: Bloomberg, Artorius
If this is the case, then companies, households and governments that relied on low interest rates to finance themselves are having to adjust to higher borrowing costs.
Higher bond yields do tend to weigh negatively on equity markets. Sometimes higher borrowing costs lead to a recession, as companies and households borrow less for investment or mortgages. Higher yields also tend to lead to lower share price valuations.
Inflation and profits
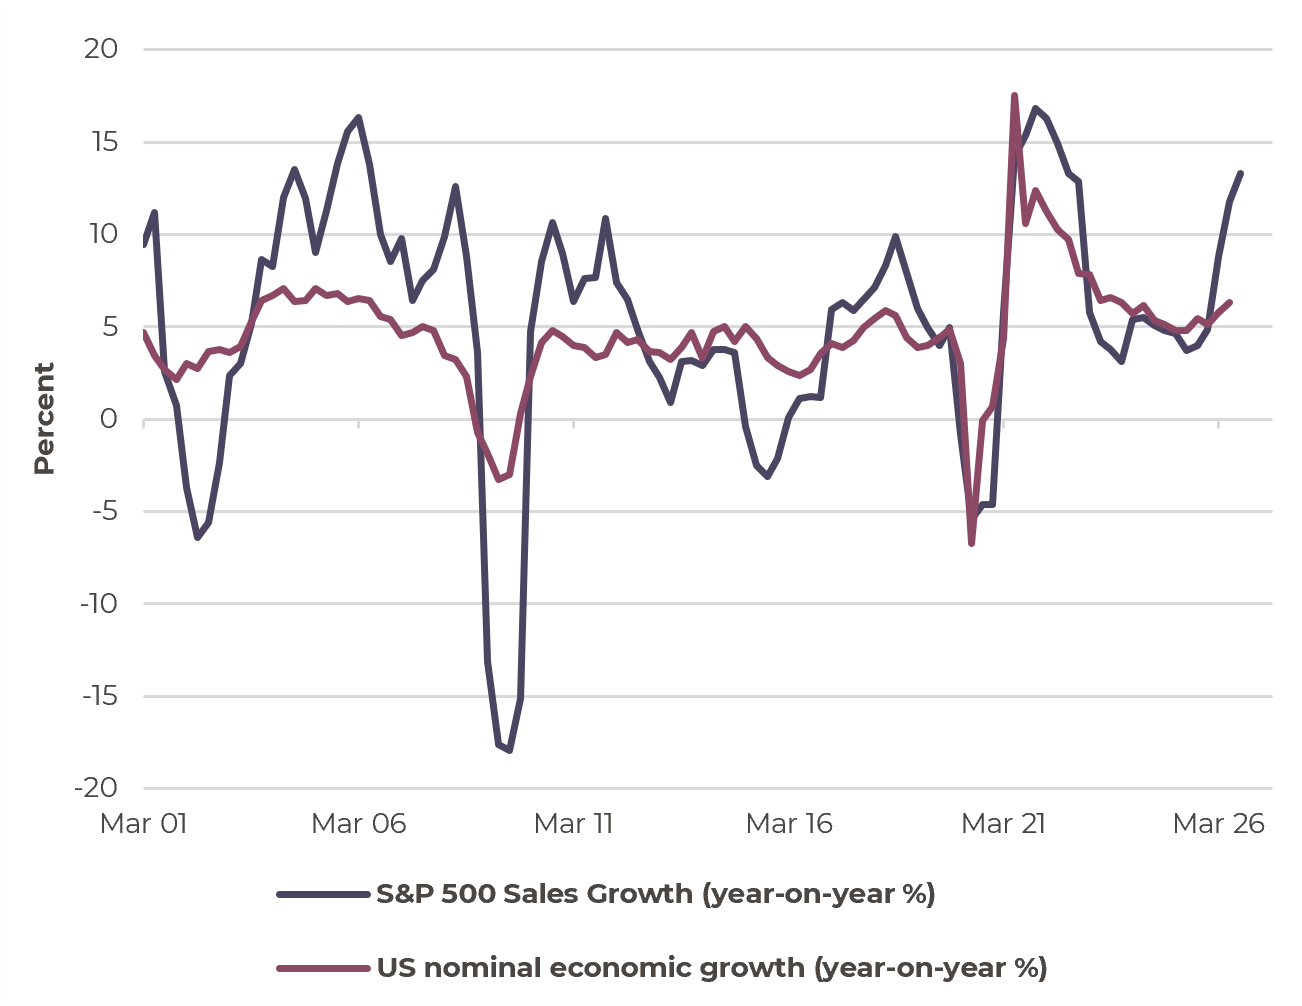
The good news for investors is that stronger nominal economic growth is a good backdrop for company revenues, and revenues are growing.
Sales growth appears linked to nominal economic growth rates
Source: Bloomberg, Artorius
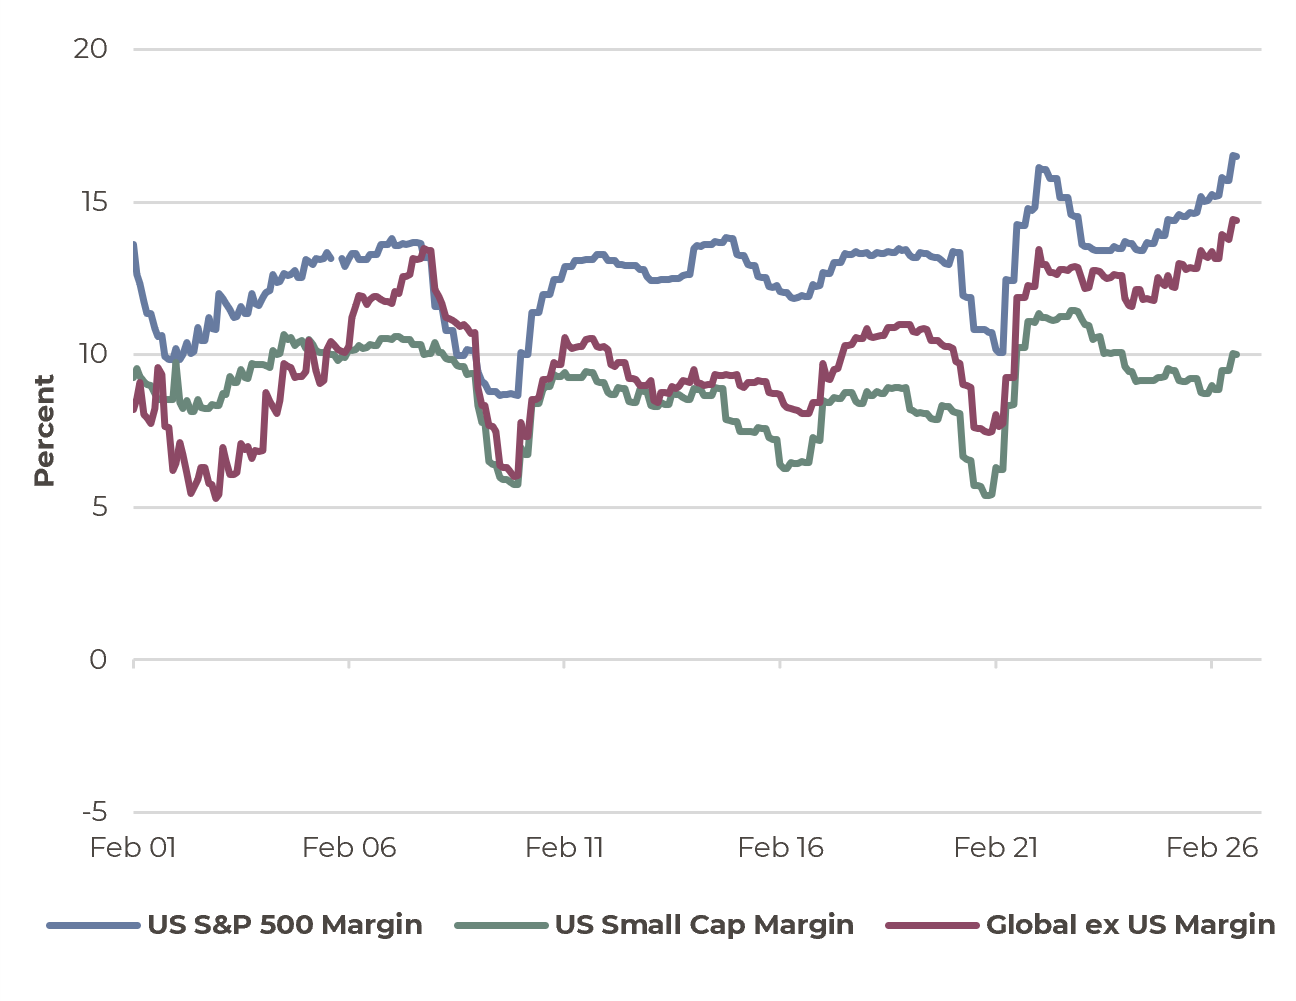
One of the striking features of corporate profitability is the extent to which companies have expanded their profit margins. In the US, it is tempting to credit this to AI and the technology giants alone. But the data suggests that companies of all sizes, around the world, are enjoying higher profit margins.
Corporate profit margins are rising in the US and across the world
Source: Bloomberg, Artorius
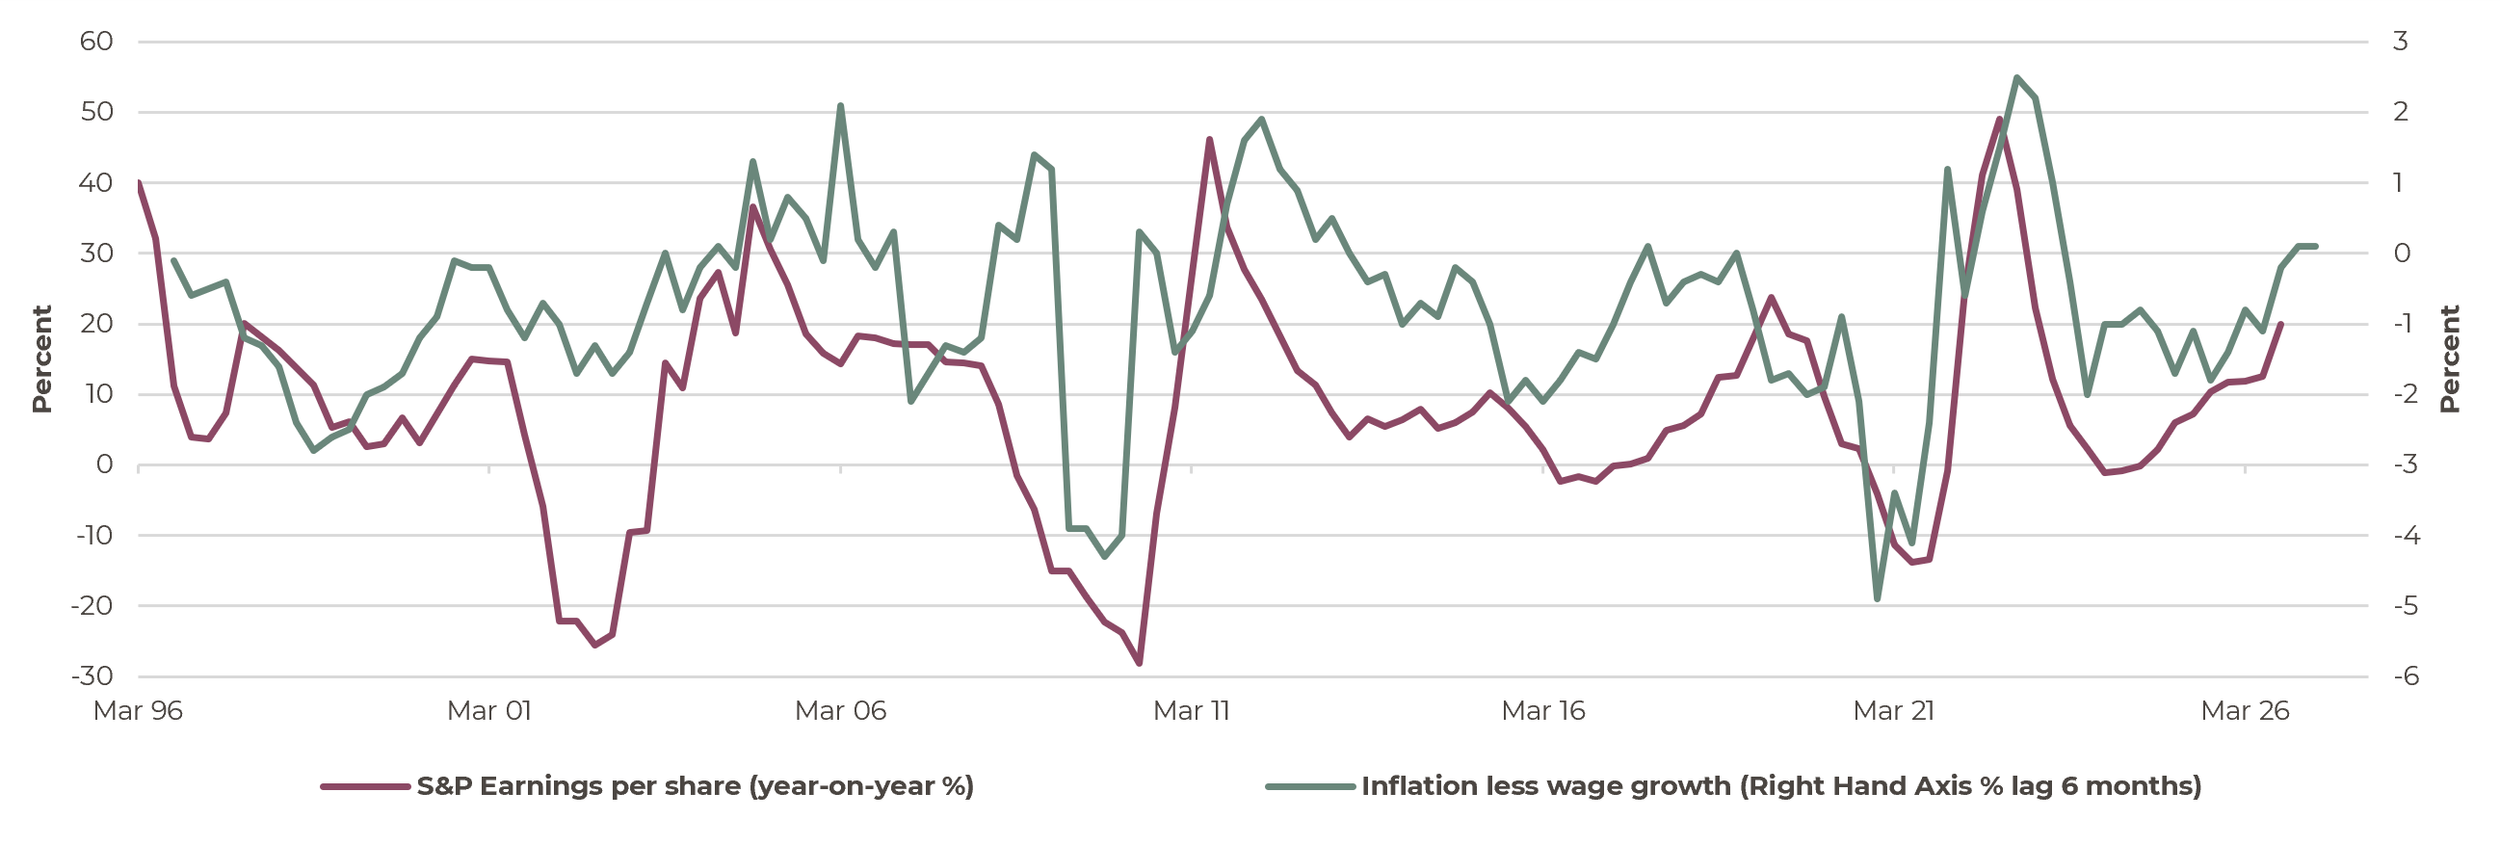
One driver of higher profits is that prices are rising faster than wages, and this gap is widening. For households, this means a squeeze on real incomes (the cost-of-living crisis), but for companies, and therefore investors, it supports profits.
Another driver appears to be a rise in new orders, as measured by the ISM (Institute for Supply Management) survey (a monthly gauge of US business activity), while companies’ hiring intentions remain lacklustre. This gap between rising activity and flat hiring could reflect an improvement in productivity, meaning companies are producing more with the same workforce.
If so, rising productivity combined with prices outpacing wages may explain why profit margins are so strong. Higher margins, together with solid revenue growth, add up to robust profits.
When price inflation outstrips wage inflation, corporate profits tend to rise strongly
Source: Bloomberg, Artorius
To date, the earnings backdrop remains buoyant, which it needs to be given higher bond yields and rising interest rates. Companies’ third-quarter results will be closely examined for signs that this strength can continue, and for evidence that the investment in AI infrastructure so far is delivering revenue.
Investors will also look closely at what companies say about financing costs, to see whether higher borrowing costs are starting to hold back their plans
AI demand is still outpacing supply, for now
Artificial intelligence is real, and demand for it appears to be growing strongly. We are at the start of the third-quarter earnings season, but so far company commentary suggests that demand for AI remains above expectations and is outstripping supply. This is creating shortages of computing power (‘compute’) and memory chips in the near term, as well as a longer-term bottleneck in the power supply for data centres. A few recent company updates below show how widespread these bottlenecks are.
Oracle’s first-quarter results (for its 2027 financial year) on 10 September gave the clearest statement from a cloud provider. The company’s release said customer demand for AI training and inferencing (running trained AI models) continues to grow faster than supply. On its results call, Oracle said 97.9% of its AI processing chips (GPUs) were in use, and capacity coming up for renewal was renewed or resold at a 20% premium to previous contracts.
ASML’s third-quarter results on 14 October are the key European data point. ASML, which makes the machines used to manufacture advanced chips, now expects its planned supply for 2027 and 2028 to fall short of demand and is looking at expanding capacity beyond a previously announced 30% increase. On its results call, it said customers are bringing forward capacity plans because they expect chip supply to remain tight until at least 2028.
Micron’s results on 30 September were probably the strongest signal of all. Management said industry demand had strengthened since the previous call, and that supply of memory and storage chips should be much tighter in 2027 and 2028 than in 2026. Chief Operating Officer Manish Bhatia said the company cannot yet see when supply and demand will come back into balance. Micron also suggested that its customers can only build as much computing capacity as their memory supply allows, meaning memory shortages are now limiting computing power itself. Three-quarters of its 2027 output is already committed, and most customer discussions have moved on to 2028.
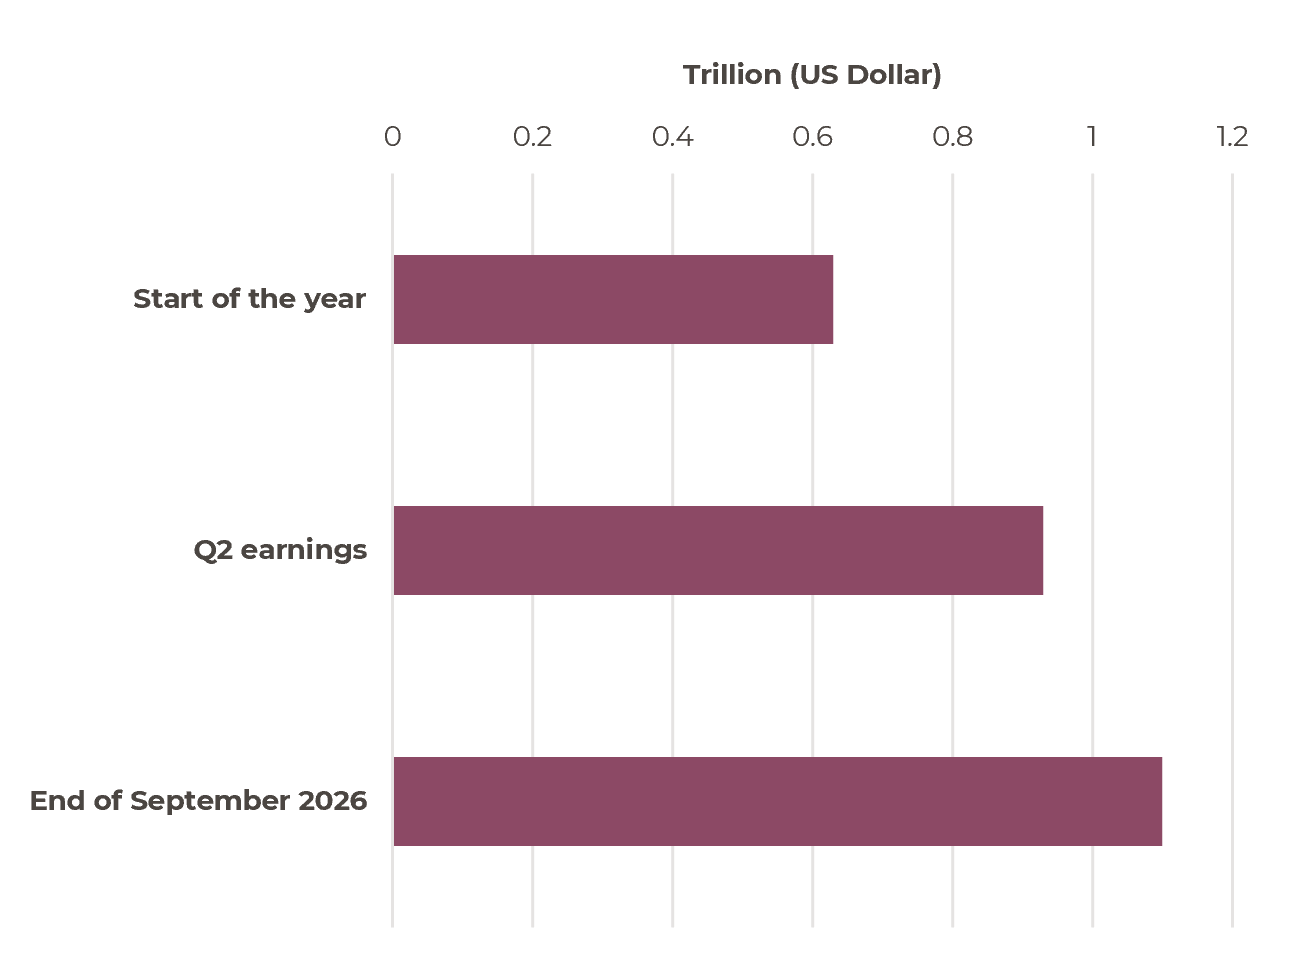
Demand has exceeded expectations, prompting the largest cloud computing companies, known as ‘hyperscalers’, to increase their investment. Growth in the hyperscalers’ capital expenditure (spending on data centres, chips and other infrastructure) is expected to ease from nearly 100% this year to 54% in 2027 and 12% in 2028, when it is projected to reach $1.4 trillion. However, estimates of 2027 spending have risen from $0.6 trillion at the start of the year to over $1.1 trillion, reflecting strong revenue growth and the higher cost of chips and AI infrastructure that emerged during 2026.
Hyperscalers’ investment spending estimates for 2027 have kept growing, from $0.6 trillion at the start of 2026 to $1.1 trillion now
Source: Bloomberg, Artorius
Cloud revenue growth at Amazon, Alphabet, Microsoft and Oracle accelerated to 48% in the second quarter of this year, up from 25% in 2024. Amazon, Alphabet and Microsoft have also reported a combined $1.7 trillion of cloud revenue backlog (future revenue from contracted services not yet delivered). Their third-quarter revenue figures, due in the coming weeks, could be key to the direction of equity markets.
US midterm elections
In normal times, US midterm elections attract plenty of commentary but rarely move markets. These do not appear to be normal times. Higher energy costs in the US have weighed on consumer confidence, despite robust US economic growth. Low consumer confidence appears likely to cost the governing Republican Party in the November midterm elections.
It seems likely that the Democrats will gain control of the House of Representatives, while the Senate race is closer. President Trump may therefore spend his final two years in the White House facing greater checks and balances on his ability to enact policy, although foreign policy (war and diplomacy) tends to lie with the President, with limited oversight from Congress.
It is possible that the President will choose to escalate tensions with the Democrats to try to shore up the Republican vote, so the next few weeks could bring further policy uncertainty and market volatility.
Conclusion

So far in 2026, economic growth has been resilient in the US, Europe and the UK. Bond markets are starting to reflect two realities: inflation remains elevated, and economic growth appears to have weathered the energy price shock, for now. However, higher energy prices and the rise in borrowing costs are likely to slow the pace of growth somewhat.
Nominal economic growth (real growth plus inflation) has returned to a pace last seen before the 2007–09 financial crisis. Between 2007 and 2019, weaker growth led to a long period of low bond yields. As nominal growth has picked up, bond yields have risen to levels that look high by recent standards but are back in the range seen between 1990 and 2007, the ‘old’ normal.
Higher bond yields are putting pressure on borrowers with heavy debts. Few companies fall into this group, but many households and governments do. Higher borrowing costs have slowed the housing market in both the UK and the US, and governments must find ways to reduce their debt burden without provoking a backlash from voters or from investors.
As we enter the third-quarter results season, investors will want to see evidence that heavy spending on AI is turning into revenue, as well as any signs that higher borrowing costs are holding back spending plans.
The US faces a bout of election fever, as the midterms take place in November. High oil prices have weighed on US consumer confidence, which is likely to hurt the governing Republican Party. The Democrats appear likely to win the House of Representatives, while the Senate race is much closer. In the run-up to the elections, policy announcements from the White House may become less predictable, which could add to market volatility.
Share prices have risen this year, but company profits have risen faster, so markets now look cheaper (on lower valuations) than they did in January. That suggests investors remain somewhat sceptical about how long the AI investment boom will last.
*Any feedback provided can be anonymous
Important Information
Artorius provides this document in good faith and for information purposes only. All expressions of opinion reflect the judgment of Artorius at 23th October 2026 and are subject to change, without notice. Information has been obtained from sources considered reliable, but we do not guarantee that the foregoing report is accurate or complete; we do not accept any liability for any errors or omissions, nor for any actions taken based on its content.
The value of an investment and the income from it could go down as well as up. The return at the end of the investment period is not guaranteed and you may get back less than you originally invested. Past performance is not a reliable indicator of future results.
Nothing in this document is intended to be, or should be construed as, regulated advice. Reliance should not be placed on the information contained within this document when taking individual investment or strategic decisions.
Any advisory services we provide will be subject to a formal Engagement Letter signed by both parties. Any Investment Management services we provide will be subject to a formal Investment Management Agreement, which will include an agreed mandate.
Artorius Wealth Management Limited is authorised and regulated by the Financial Conduct Authority. Artorius is a trading name of Artorius Wealth Management Limited.
FP20261023001